Animated Histograms
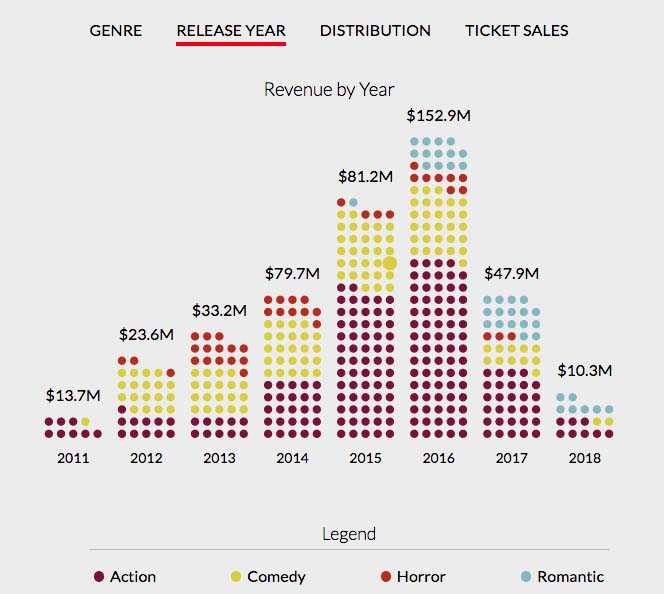
Circles are animated to construct various histograms, or charts of distribution of values. It was a fun challenge to calculate the positions of over 400 circles in a reusable fashion. There are 2 types of histograms used, one with columns of a fixed-width, and another where the application attempts to create a perfect square (dynamic width). Users are automatically shown the 4 possible ways of segmenting the data when the application first laods. Users can trigger animations by using the 4 menu buttons. It is based on fake data, for now, but will hopefully include more interesting and real data soon!
React/Redux & D3.js Visualization of TV Ratings
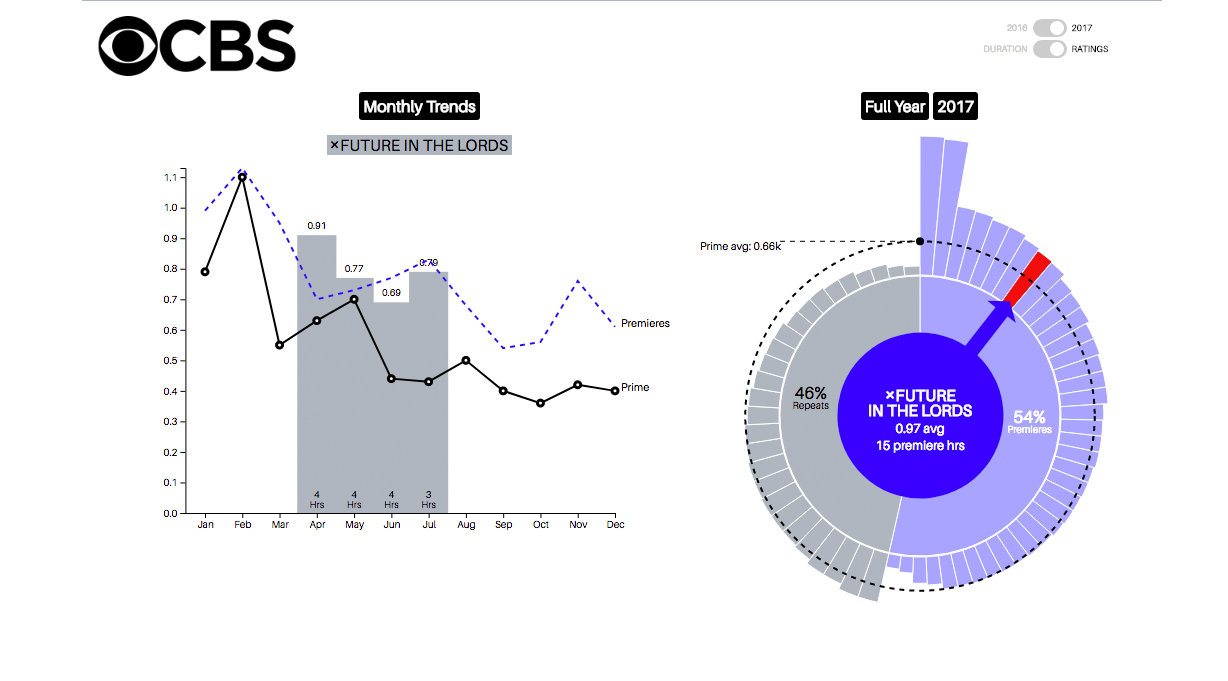
A data visualization tool designed using hypothetical TV show lineups and ratings. The tool allows exploration of a network's yearly Prime lineup and the drivers of performance. It includes a "STORY MODE" that walks users through a series of pre-programmed bullet points/observations while highlighting pertinent information.
Census Data Visualization
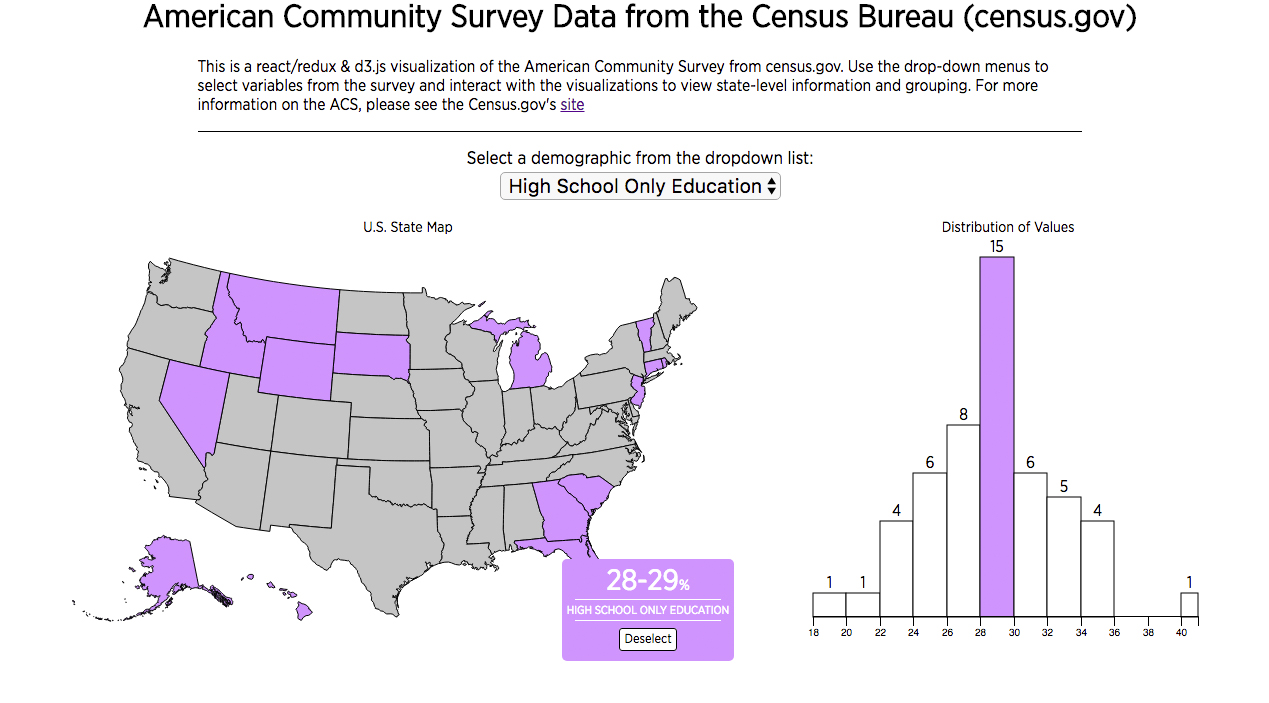
A d3.js visualization using the Census Bureau's API for the American Community survey. Built with Redux, React and D3.js. The components are all stateless (except the map which requires loading the loading of an external us map file). Styles are provided in JS thru the use of styled-components.